- What are microarrays?
- How microarrays are read?
- The problem we're addressing – noise
- Prior works
- Synthetic data generation
- Discussion on metrics and alternative denoising methods
- New metric for microarray denoising models
- New state-of-the-art model for microarray denoising
- Q&A
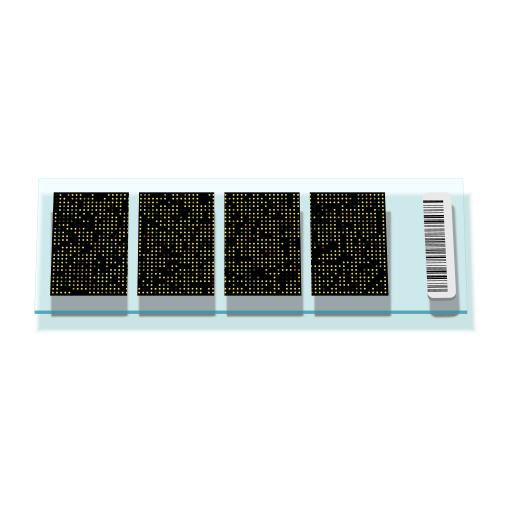
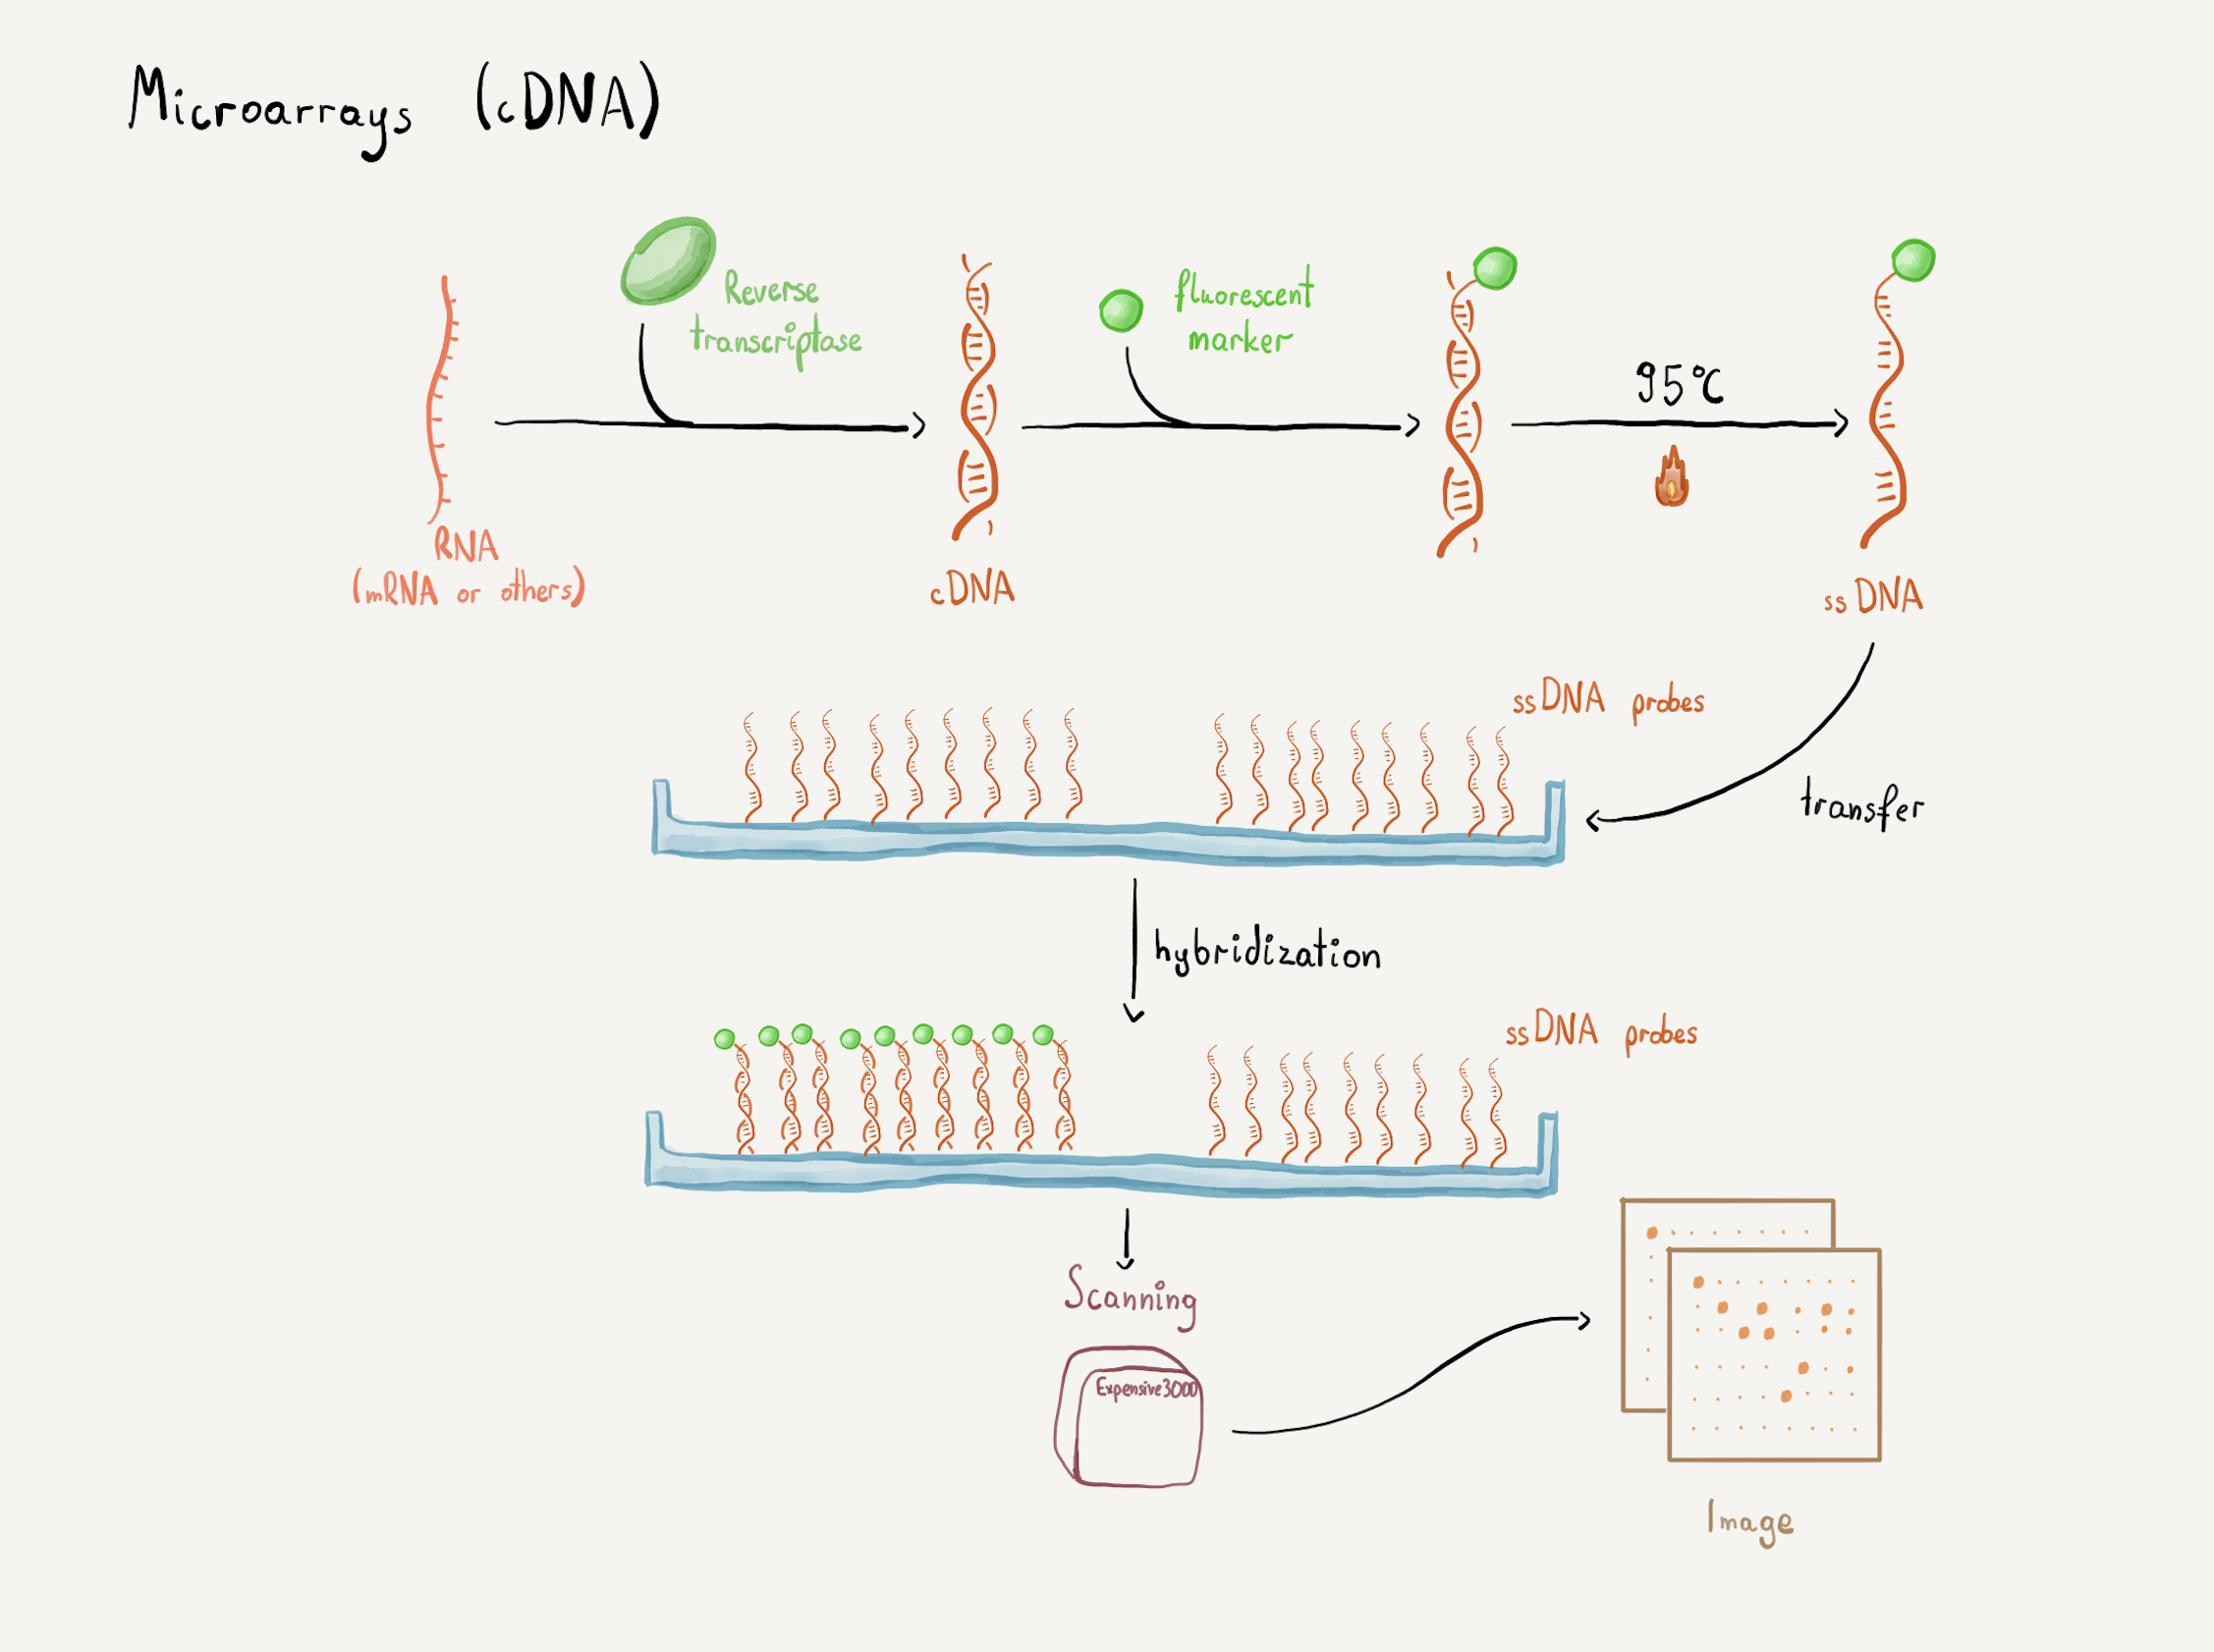
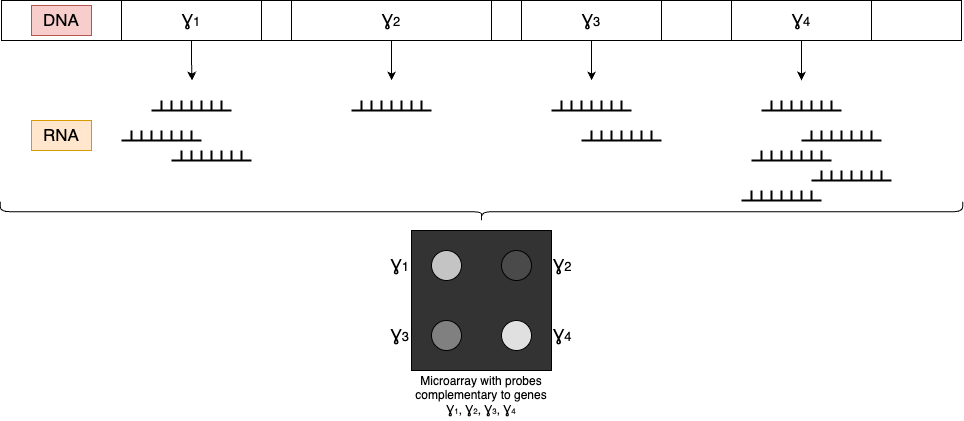
- Each dot position corresponds to a specific sequence (e.g. a gene)
- The intensity of each dot can be measured and compared against a control sample
- The relative intensity of each dot corresponds to the quantity of a given sequence in a sample (e.g. gene mRNA in a particular virus)
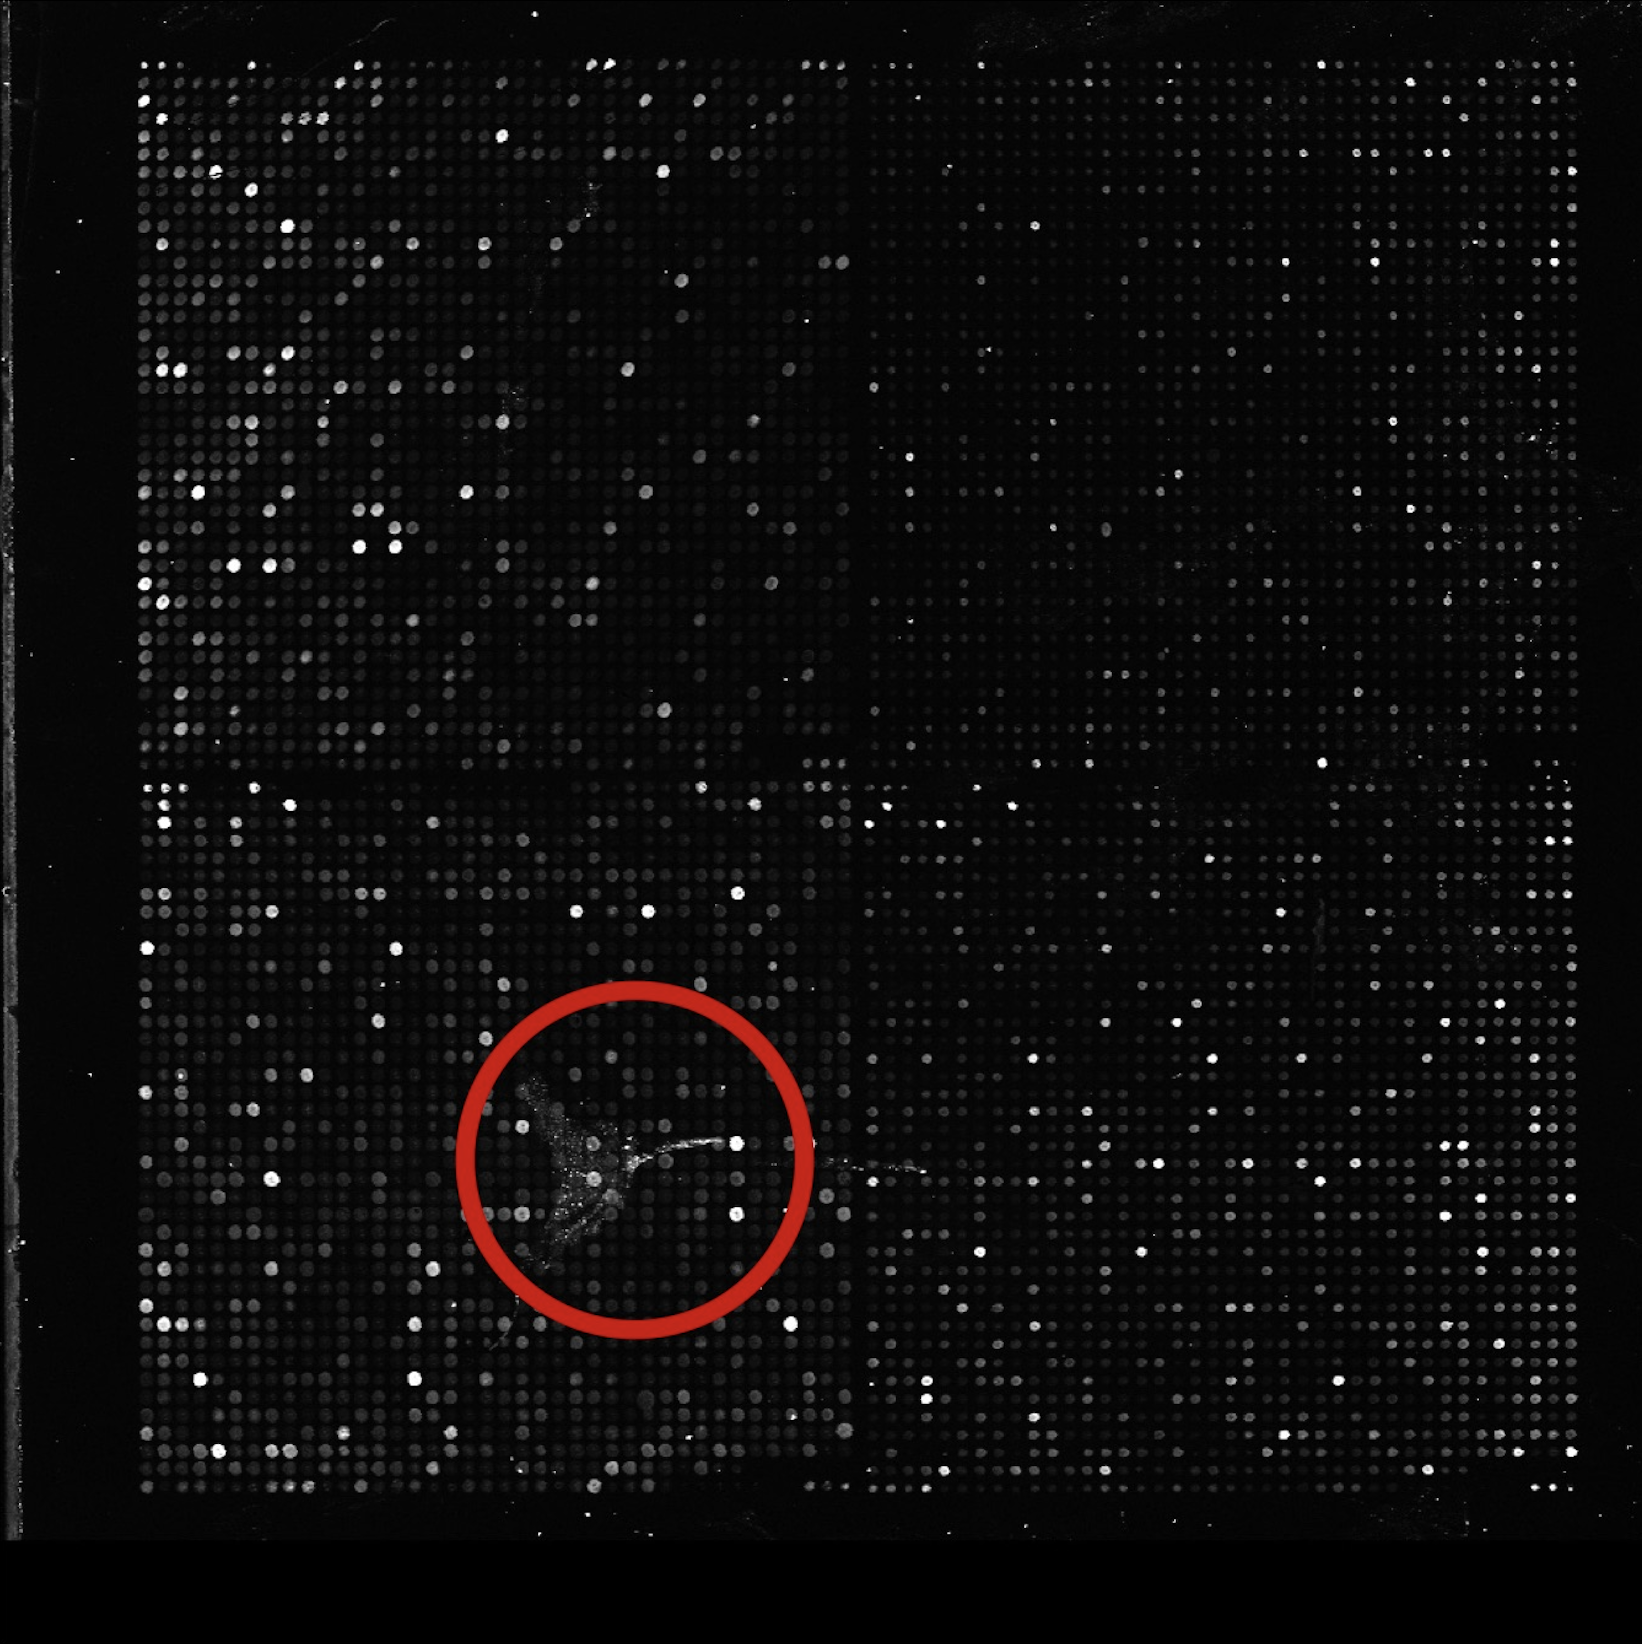
- Dust particles and dirt that gets onto the glass slide during preparation
- Noise from the scanning process
- Up to 2020, only classical methods have been used
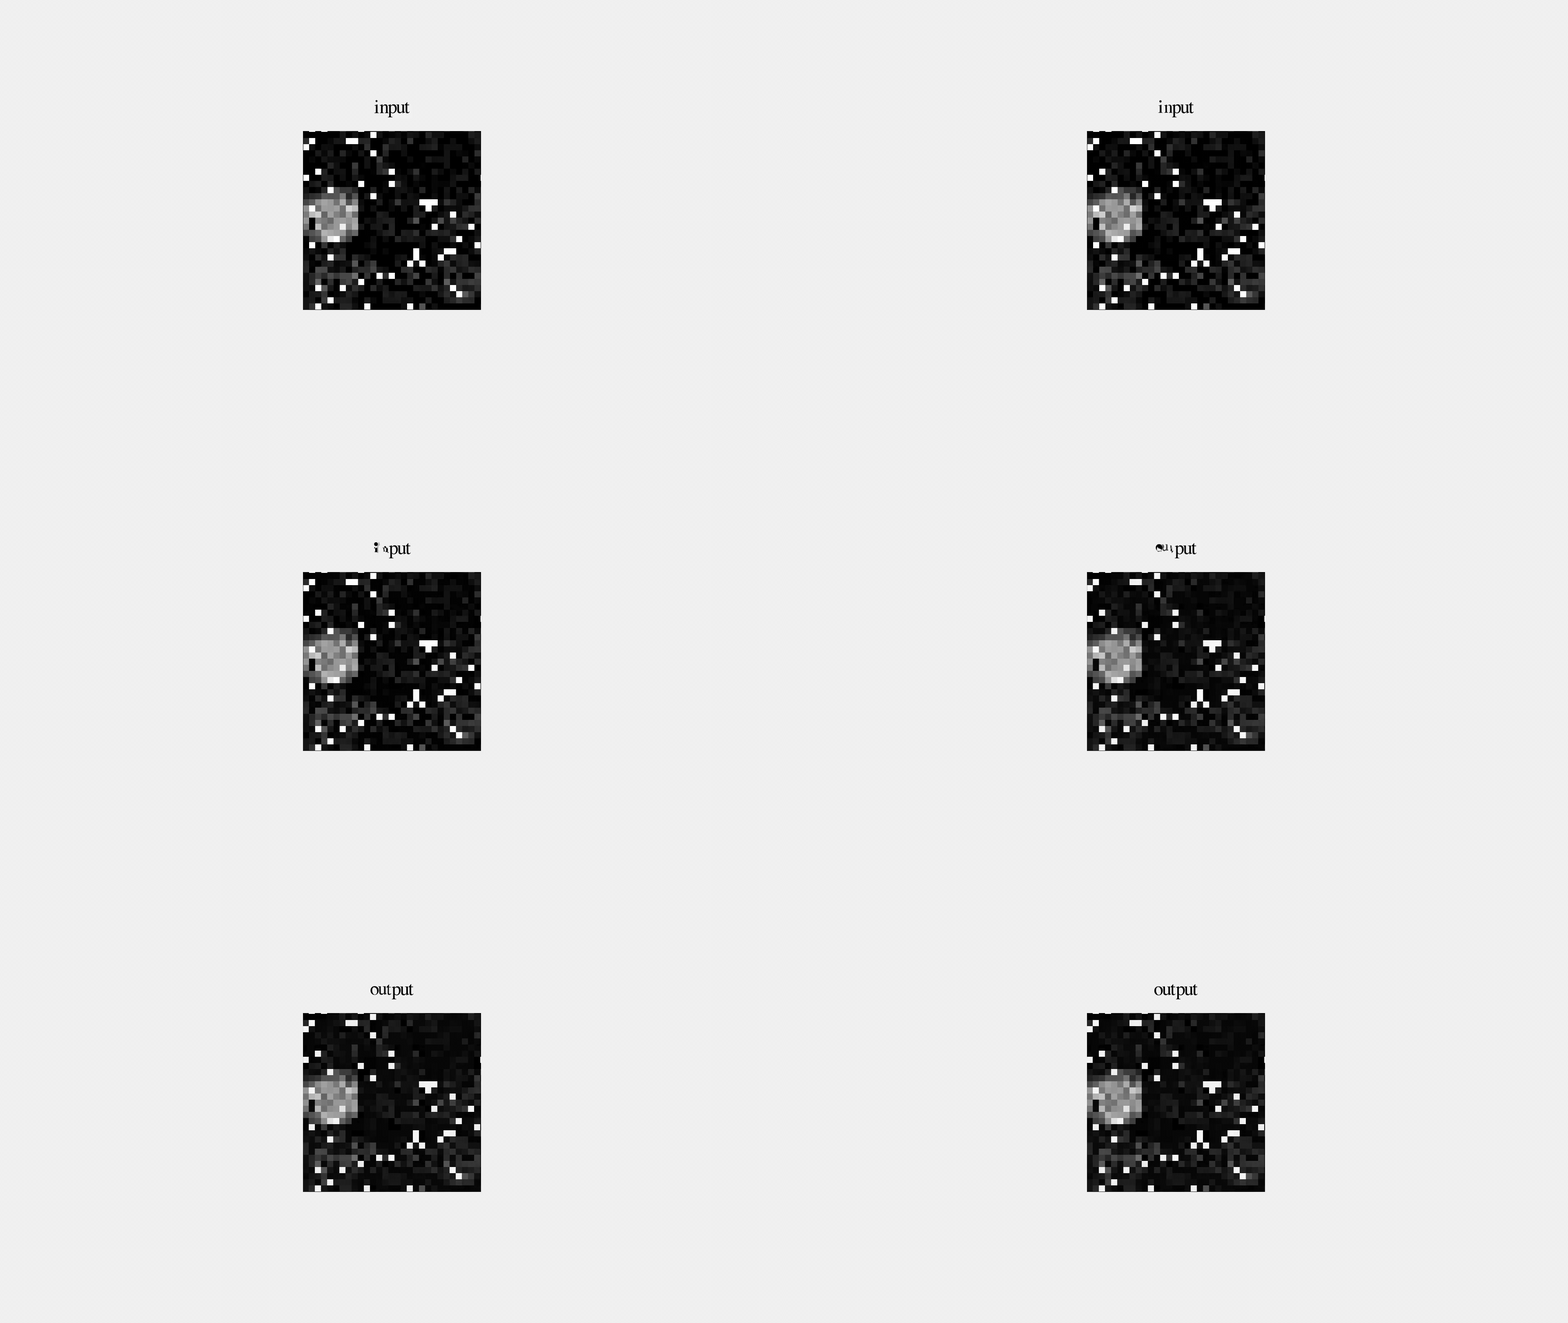
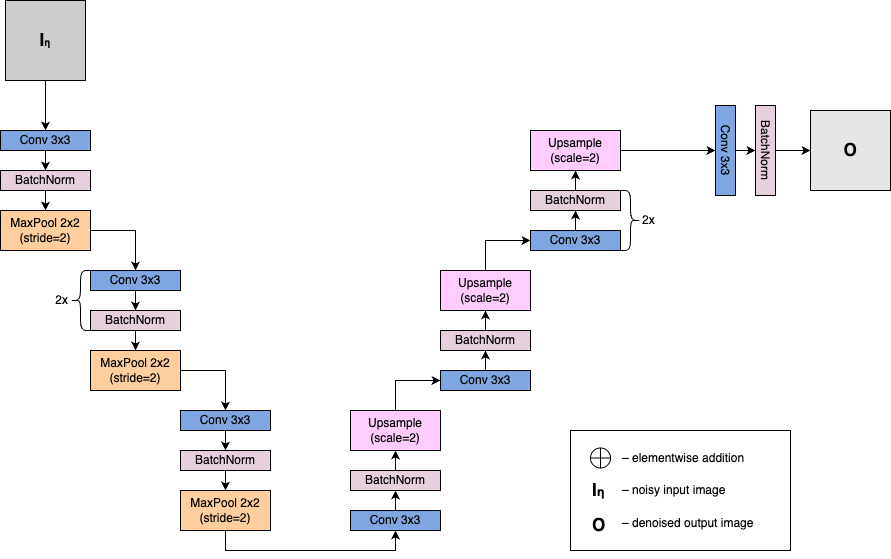
- 2020 marks the first and only (to date) application of a deep-learning denoising method (Mohandas et al. [1])
- \(\psi_{j,k}(t)\) are the wavelet basis functions at scale j and position k
- \(\langle \cdot, \cdot \rangle\) denotes the inner product
- State-of-the-art according to the Peak Signal-to-Noise Ratio criterion
- But... It was trained on real microarray images which can never be guaranteed to be noise-free
- In PSNR: \(MSE = \frac{1}{mn} \sum\limits_{i=0}^{m-1}\sum\limits_{j=0}^{n-1} (G(i,j) - O(i,j))^2\)
- In f-PSNR: \(MSE = \frac{1}{mn} \sum\limits_{i=0}^{m-1}\sum\limits_{j=0}^{n-1} (I_\eta(i,j) - O(i,j))^2\)
- \(O\) -> the cleaned/output image
- \(I_{\eta}\) -> the noise-added image (input image)
- \(G\) -> the ground-truth image
- \(n\) and \(m\) are the rows and columns for a gridded microarray image respectively
- \(\operatorname{imeasure}\) is the pixel intensity measurement operator
- \(R\) is the reference image (all dots at 50% pixel intensity)
- \(G\) is the ground-truth image
- \(O\) is the denoised (output) image
- $\mathbf e_G$ indicates the expression value vector collected from the ground-truth image
- $\mathbf e_O$ indicates the expression value vector collected from the denoised image.
- We addressed the problem of denoising of microarray images
- We proposed a synthetic data generation pipeline for microarray image datasets
- We introduced a new domain-specific metric for assessing the power of denoising models (SADGE)
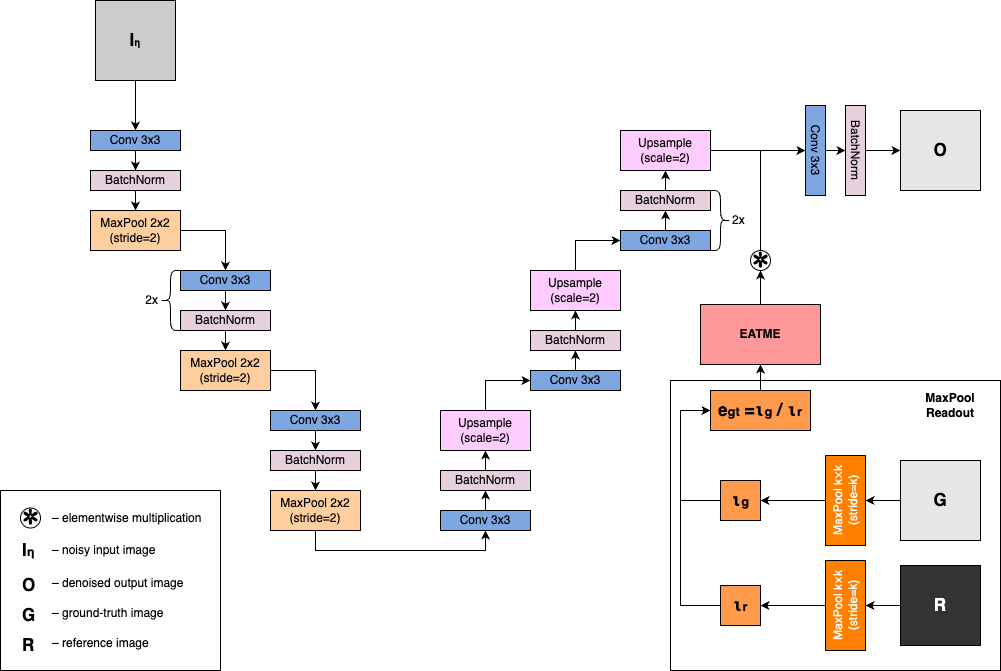
- We introduced a new state-of-the-art microarray image denoising model trained on the synthetic dataset leveraging the autoencoder architecture with the EATME module and an additional loss term penalizing the training for inaccurate expression readouts (DEL)
What are microarrays?
Reading information from microarray images
Suppose you are given a virus that has just 4 genes in its genome and you want to study which genes are active in the early infection stage vs. late infection stage.
Things to remember
But what's the problem?
Noise:
Repeating experiments in a wet lab is expensive
How prior works approached this?
Example of classical denoising – Wavelet Transform Denoising
Wavelet Transform Denoising applies to images by decomposing them into localized frequency components in the spatial domain.
The discrete wavelet transform (DWT) of a signal can be expressed as:
$$W_{j,k} = \langle f(t), \psi_{j,k}(t) \rangle$$
Where:
The noisy signal f(t) is decomposed into wavelet coefficients using the DWT:
$$\{W_{j,k}\} = \text{DWT}(f(t))$$
But it's not great...
Denoising Autoencoder
But is it good?
Idea: why don't we generate our own data?

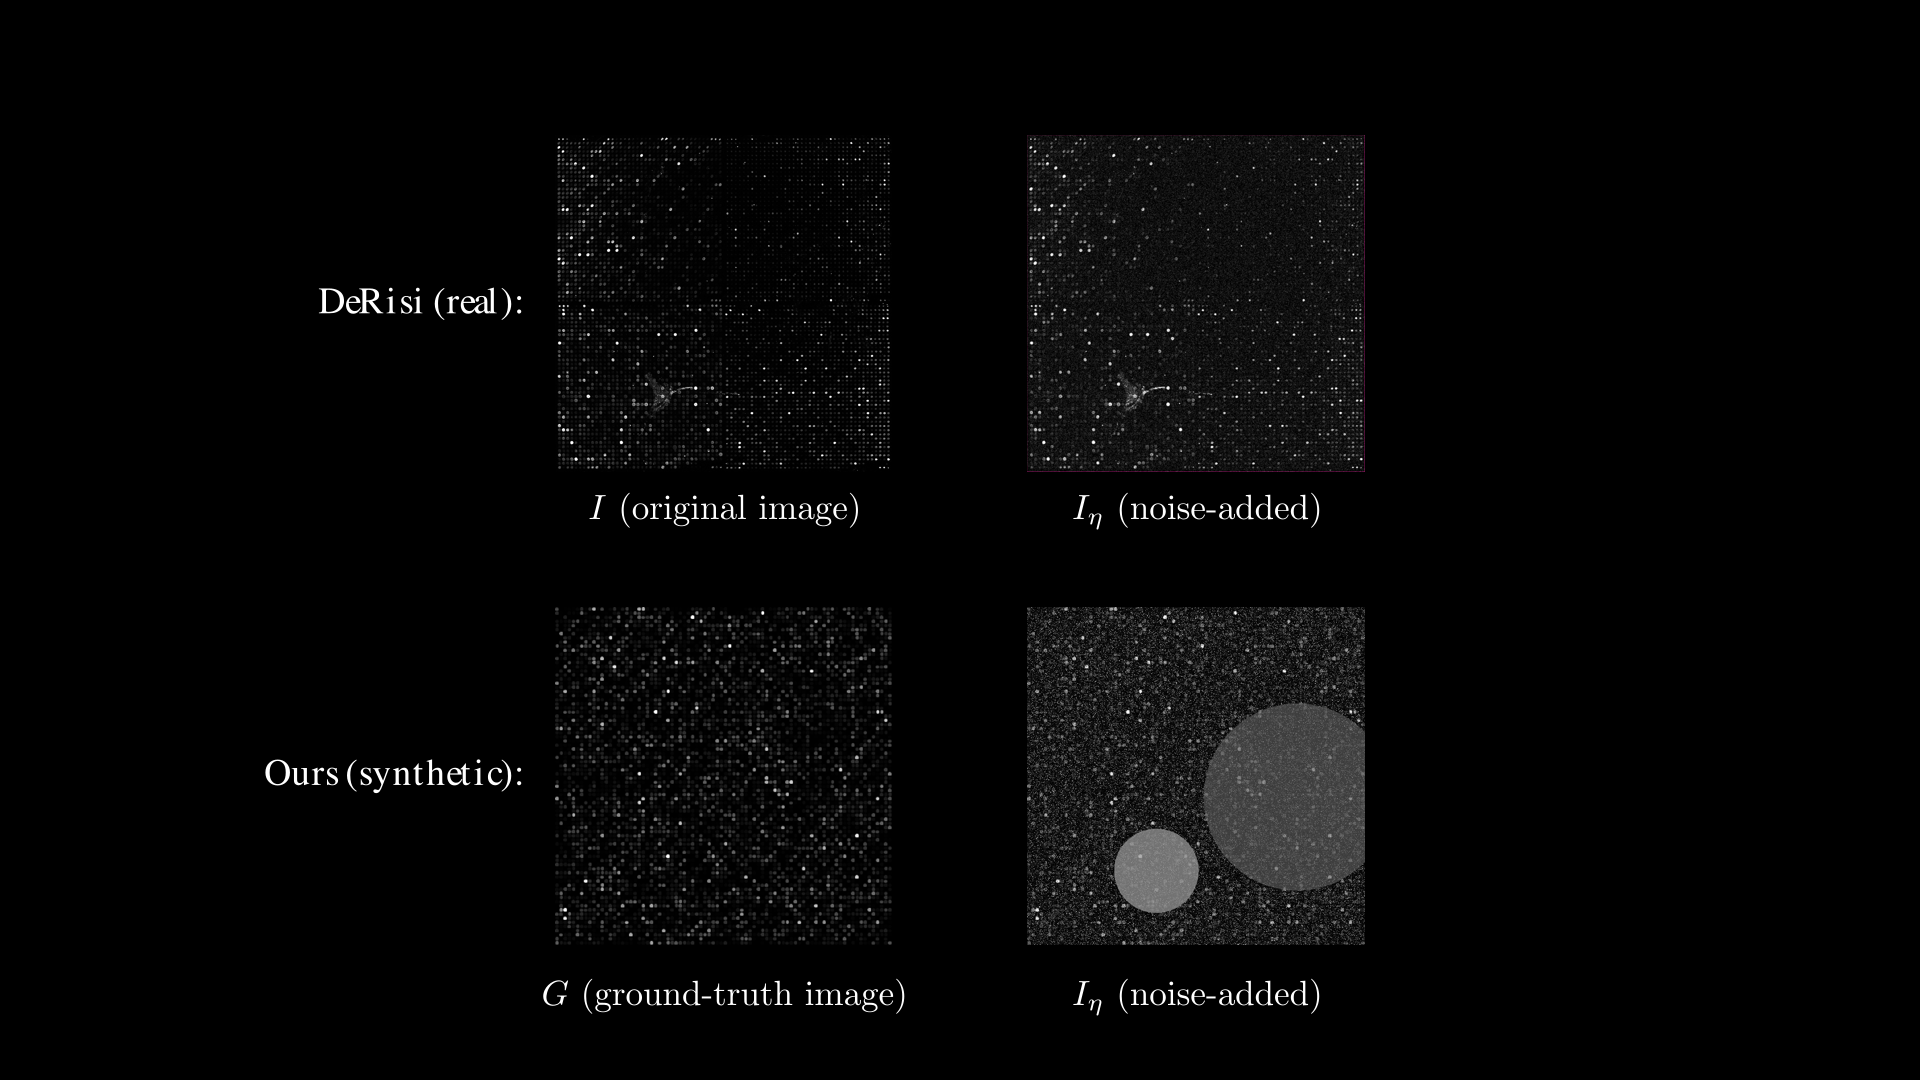
Can we use the same Autoencoder architecture and improve the denoising power by simply training it on a large corpus of synthetic data?
PSNR on synthetic dataset (higher is better)
| Method | PSNR (Synth test) |
|---|---|
| AE Baseline | 17.7472 |
| AE Synth | 28.1942 |
f-PSNR on DeRisi dataset (lower is better)
| Method | f-PSNR (DeRisi crop test) |
|---|---|
| AE Baseline | 23.4593 |
| AE Synth | 22.0562 |
But what are PSNR and f-PSNR?
MSE stands for Mean Square Error.
MSE:
Where:
Job done?
We kept asking questions...
Is an autoencoder the optimal architecture for denoising microarray images?
Is PSNR or f-PSNR a metric that should be used for microarrays, given the semantic meaning of each position in the grid?
Is it possible that the denoising model removes relevant information?
Better denoising architectures?
Restormer [2]
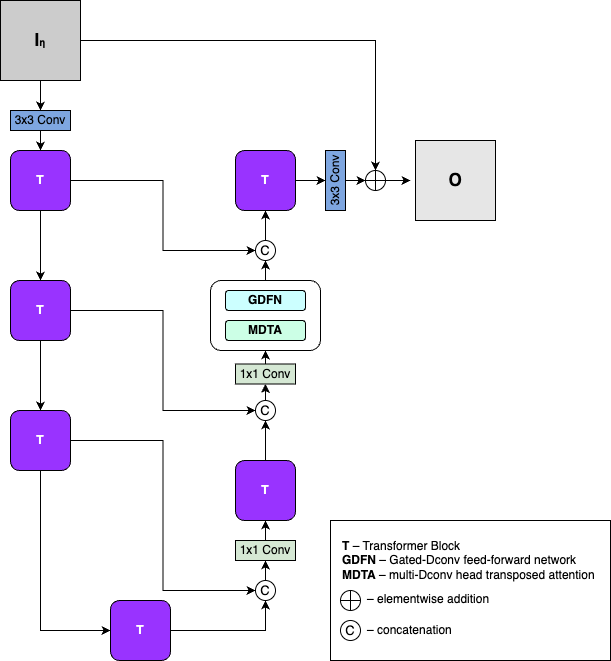
Results were so good we couldn't believe our eyes
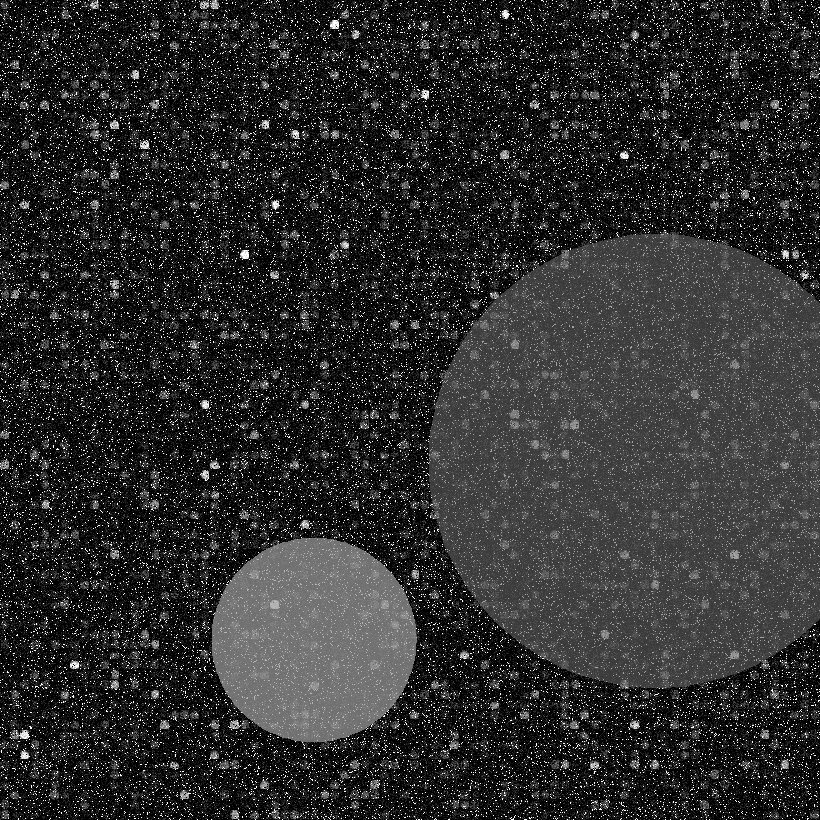
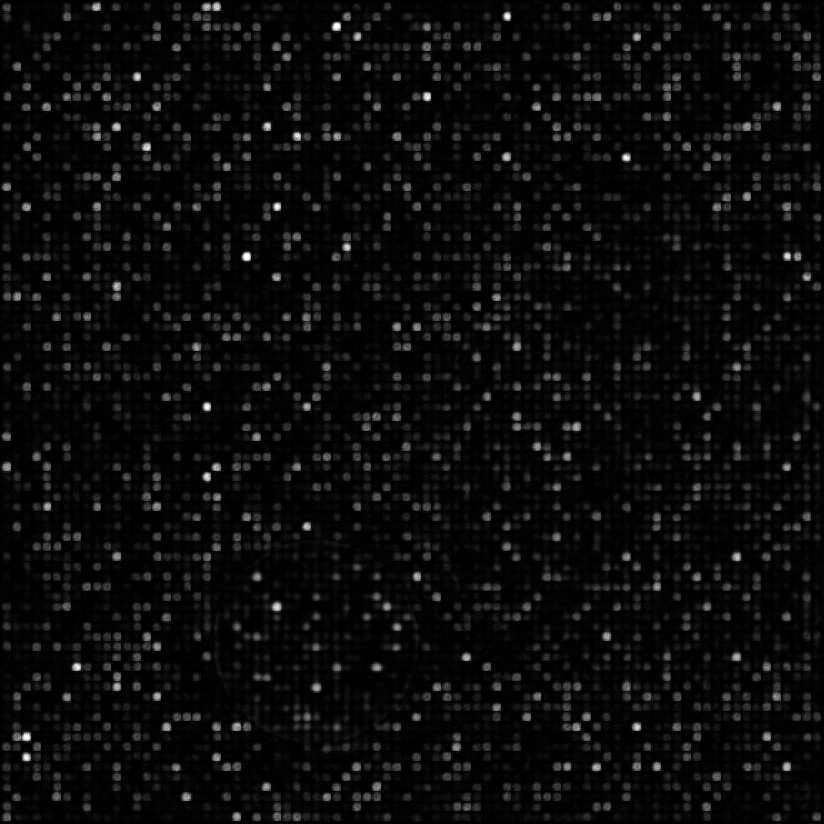
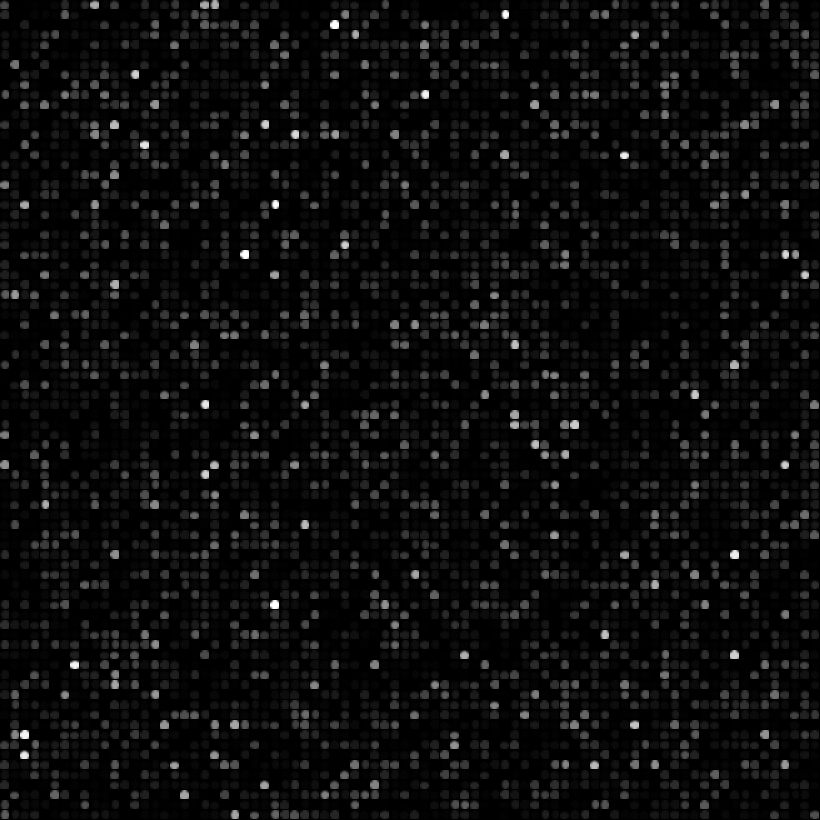
Left-to-right: (1) input, (2) Restormer output, (3) ground-truth
Quantitative results were also stellar
PSNR on synthetic dataset (higher is better)
| Method | PSNR (Synth test) |
|---|---|
| AE Baseline | 17.7472 |
| AE Synth | 28.1942 |
| Restormer | 29.4749 |
f-PSNR on DeRisi dataset (lower is better)
| Method | f-PSNR (DeRisi crop test) |
|---|---|
| AE Baseline | 23.4593 |
| AE Synth | 22.0562 |
| Restormer | 22.5572 |
Then we took a closer look...
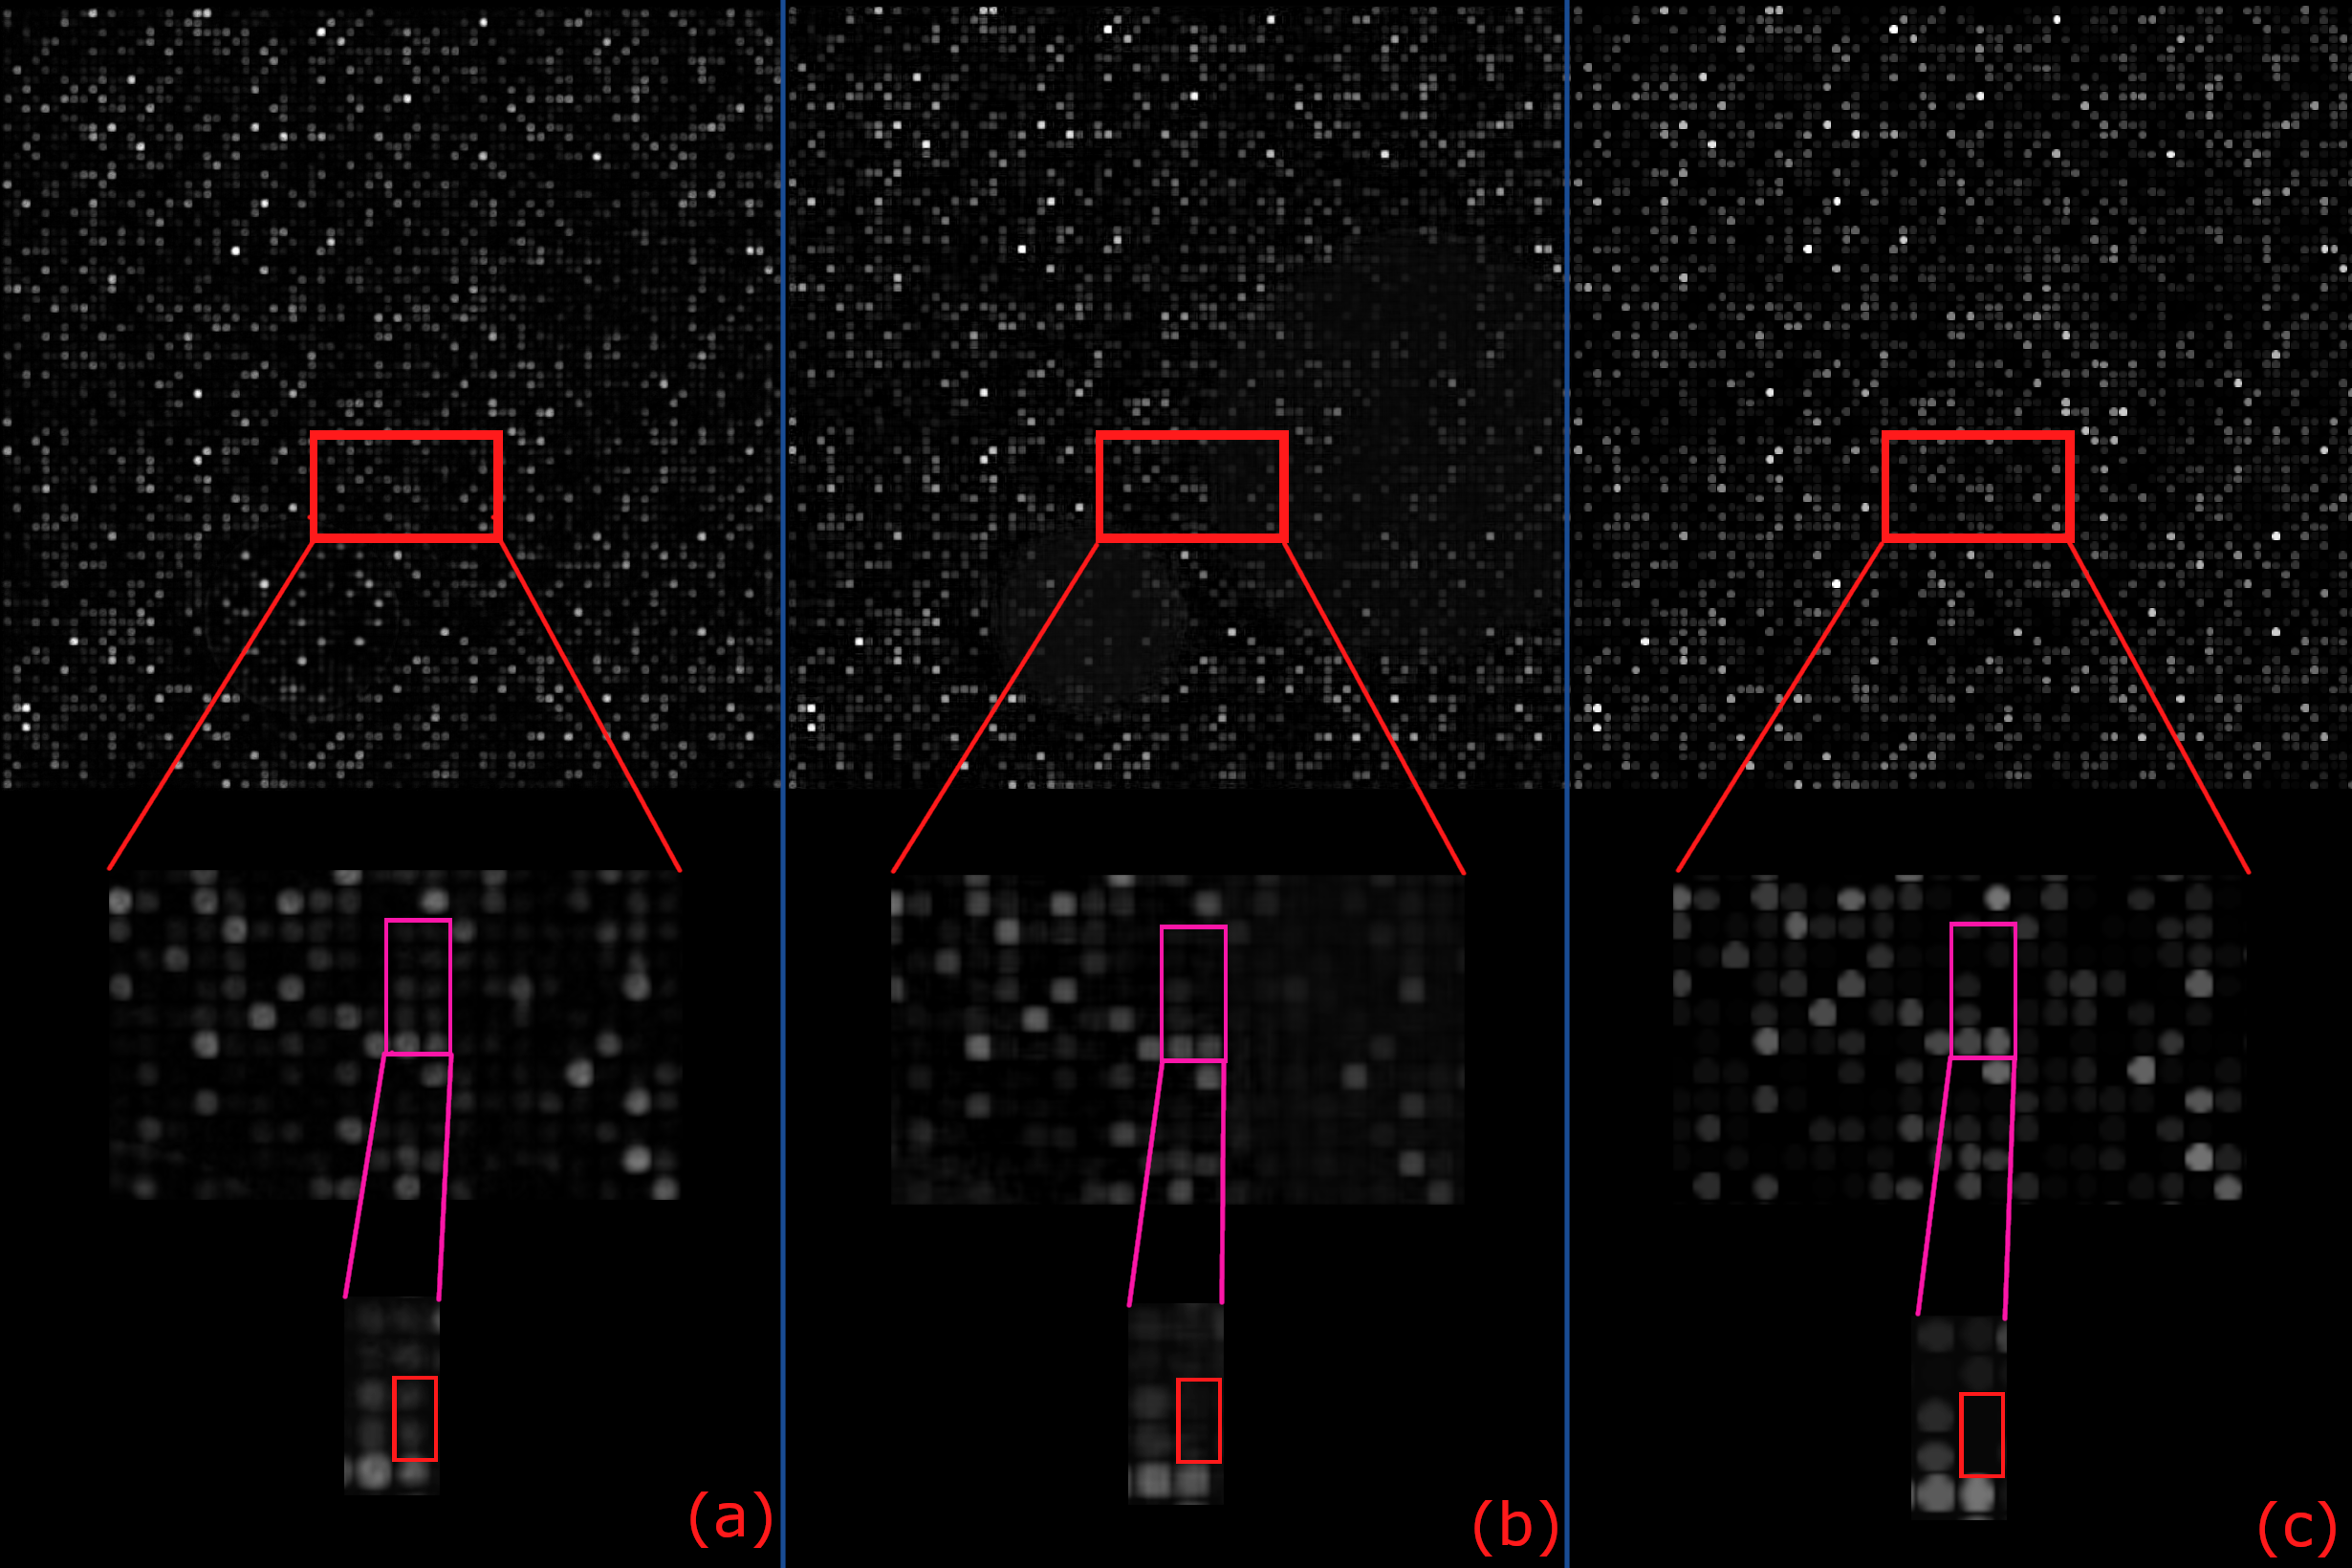
(a) Restormer, (b) our best-performing model, (c) ground-truth
We need a domain-specific metric!
Introducing SADGE
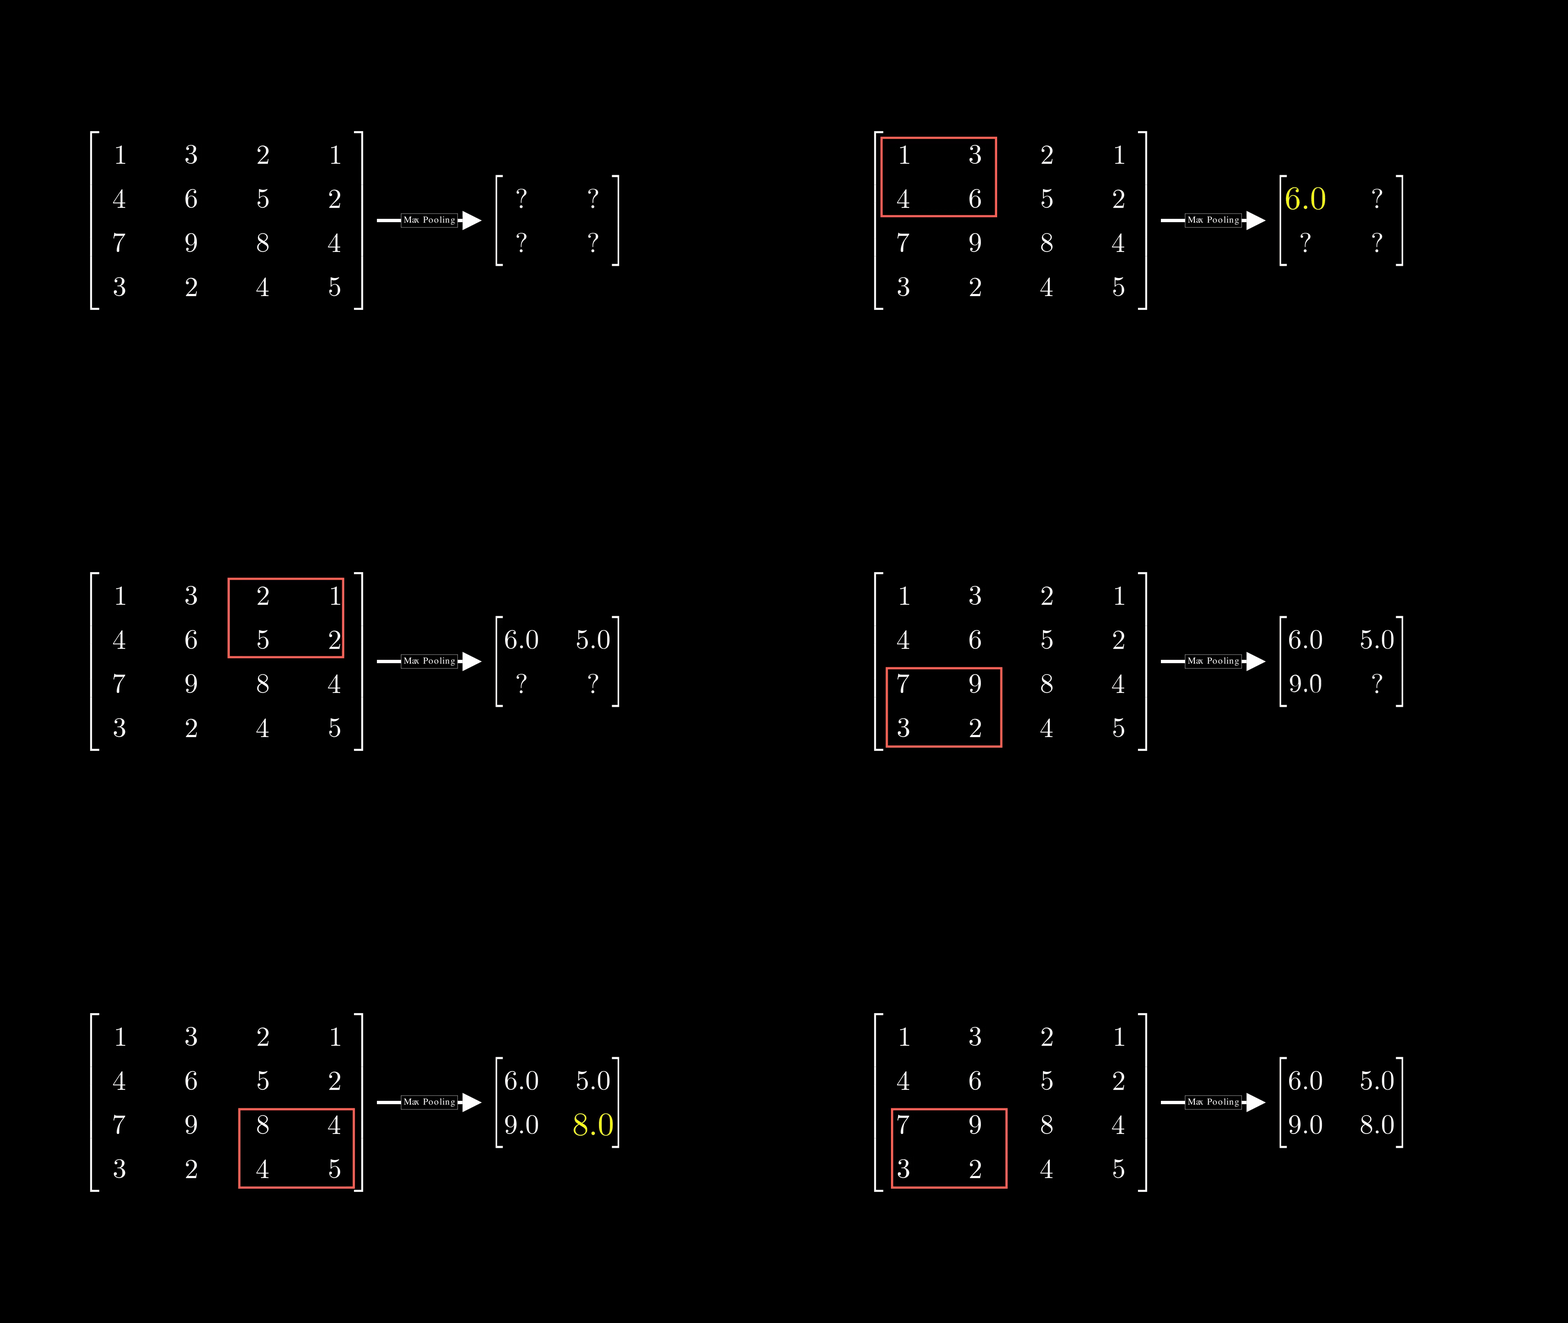
Standard Assessment of Denoising in Gene-chip Evaluation (SADGE)
Where:
Results so far
SADGE (lower is better)
| Method | SADGE (MP, Synth test) |
|---|---|
| AE Baseline | -0.6397 |
| AE Synth | -1.1172 |
| Restormer | -1.0804 |
OK, but how does SADGE work?
We asked yet another question...
Now that we can measure intensities of dots on the synthetic microarrays, can we use them to further condition the training?
Introducing EATME
Elementwise Attention-like Transform for Microarray Enhancement (EATME)
Dot Expression Loss
We also add the following loss term to the total loss:
Where:
Results (last time, I swear)
Test-stage PSNR on the synthetic dataset (higher is better)
| Method | PSNR (Synth test) |
|---|---|
| AE Baseline | 17.7472 |
| AE Synth | 28.1942 |
| Restormer | 29.4749 |
| AE Synth (with residuals) | 28.1569 |
| AE Synth (normal) | 17.4355 |
| AE Synth (EATME, DEL) | 28.3126 |
Test-stage SADGE (lower is better)
| Method | SADGE (MP, Synth test) |
|---|---|
| AE Baseline | -0.6397 |
| AE Synth | -1.1172 |
| Restormer | -1.0804 |
| AE Synth (with residuals) | -1.1012 |
| AE Synth (normal) | -0.4674 |
| AE Synth (EATME, DEL) | -1.1225 |
Test-stage f-PSNR on the DeRisi dataset (lower is better)
| Method | f-PSNR (DeRisi crop test) |
|---|---|
| AE Baseline | 23.4593 |
| AE Synth | 22.0562 |
| Restormer | 22.5572 |
| AE Synth (with residuals) | 22.0000 |
| AE Synth (normal) | 20.6842 |
| AE Synth (EATME, DEL) | 22.1591 |
Summary
References
[1]: A. Mohandas, S. M. Joseph, and P. S. Sathidevi, ‘An Autoencoder based Technique for DNA Microarray Image Denoising’, in 2020 International Conference on Communication and Signal Processing (ICCSP), Chennai, India: IEEE, Jul. 2020, pp. 1366–1371. doi: 10.1109/ICCSP48568.2020.9182265.
[2]: S. W. Zamir, A. Arora, S. Khan, M. Hayat, F. S. Khan, and M.-H. Yang, ‘Restormer: Efficient Transformer for High-Resolution Image Restoration’, Mar. 11, 2022, arXiv: arXiv:2111.09881. doi: 10.48550/arXiv.2111.09881.

